
BD Monitor - app for working with the database







Application "Monitor DB" is designed for profiling: collecting and analyzing statistical data about database queries, and reviewing summaries of this information.
With the "Monitor DB" app you can:
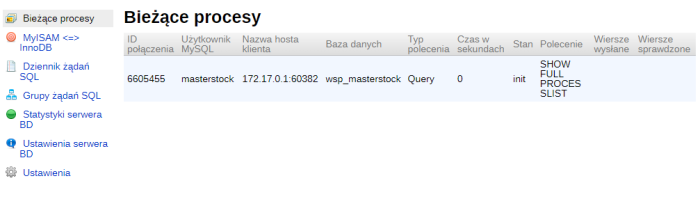
- view current database processes;
- mass change the storage engine of database tables: from InnoDB to MyISAM and from MyISAM to InnoDB;
- log SQL queries over a period ranging from 1 minute to 24 hours;
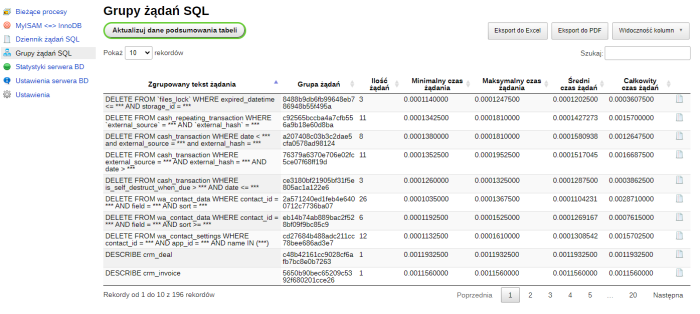
- analyze and group logged queries for further review of summary information;
- view the last 100 queries within a query group, including stack trace (you can see the chain of classes and methods that triggered this query);
- display the 100 slowest queries in a query group, including stack trace (you can see the chain of classes and methods that triggered this query);
- export overall statistics of query groups to Excel or PDF format;
- view the execution plan of a query group;
- review summary information about database tables involved in a query group;
- review recommendations for creating indexes on database tables;
- add/remove indexes based on recommendations;
- obtain the current execution time of the slowest query from a query group and compare it with old and average times to analyze the impact of changes made to the database structure;
- view recently logged SQL queries (with a configurable limit from 1000 to 50000 queries);
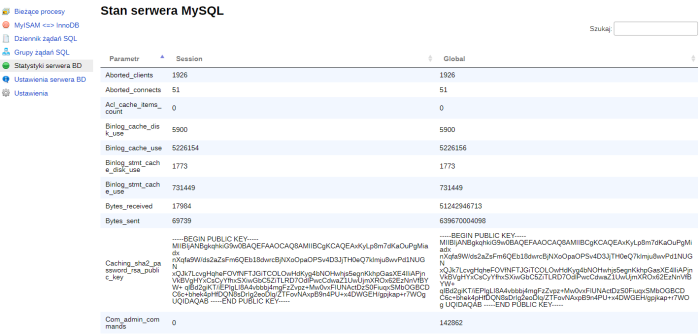
- view MySQL server statistics/status;
- view MySQL server settings.
Application "Monitor DB" does not work on the principle of "install and speed up your database" — it is a tool intended for specialists with expertise in working with databases.
Using the "Monitor DB" app.
Current processes.
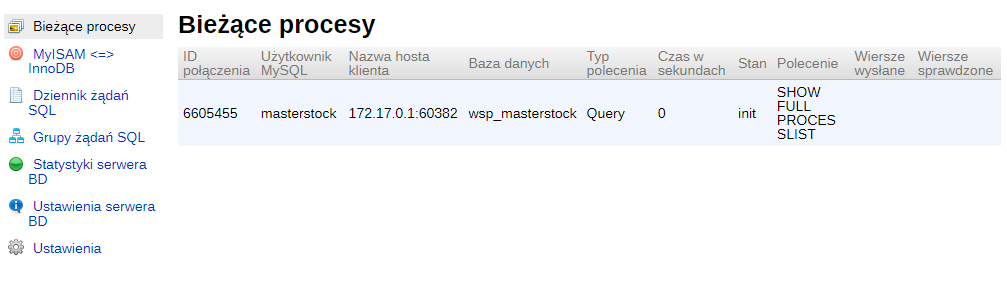
On this page, you can see which threads are currently running. This information can also be obtained using the mysqladmin processlist command. If you have SUPER privileges, you can view all threads; otherwise, only your own threads.
This information is very useful if you receive an error message 'too many connections' and need to find out what is happening.
Changing the storage engine.
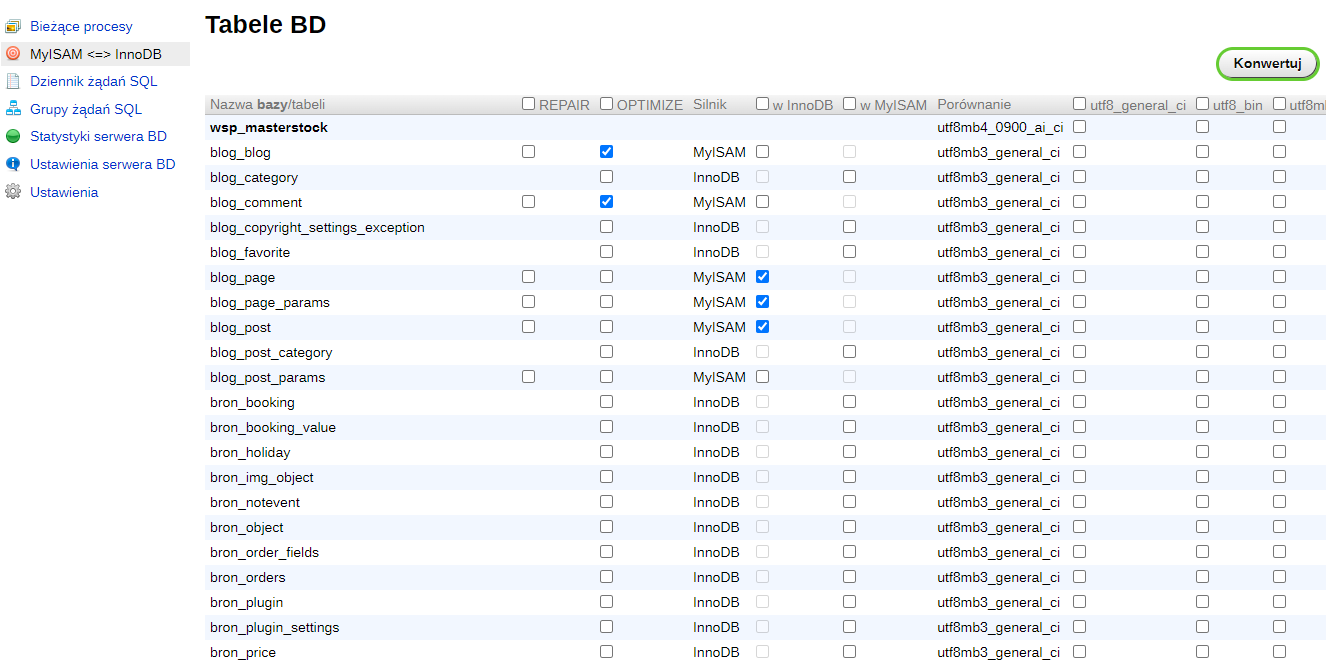
On this page, you can mass change/select the storage engine for each database table: InnoDB or MyISAM. The table below describes the differences between these two engines with simple examples.
| Description | MyISAM | InnoDB |
|---|---|---|
| Transaction support - a block of SQL statements that, in case of an error in one request, rolls back to the previous state (Rollback), and only commits (Commit) when all requests are successfully executed. | No | Yes |
| Foreign key support is a way to link records in two tables via specific fields so that updating a field in the parent table automatically updates the corresponding field in the child table (when creating a key, you define the child and parent; more precisely, you create a key in the child table that references the parent table). | No | Yes |
| Row-level locking, meaning that if a process needs to update a row in a table, it locks only that row, allowing others to concurrently update other rows. | Table-level | Row-level |
| Simultaneous requests to different parts of a table. | Slower | Faster |
| Under mixed table load (select/update/delete/insert) | Slower | Faster |
| Insert operation | Faster | Slower, due to transaction overhead, but this is the price of reliability. |
| If read operations (SELECT) predominate | Performs faster | Performs slower |
| Deadlock — a situation in a multitasking environment or DBMS (Database Management System) where several processes are in a state of infinite waiting for resources captured by those same processes. | Do not occur | Possible. |
| Full-text search support | Yes | No (available from MySQL 5.6.4) |
| Count(*) query | Faster | Slower |
| mysqlhotcopy support is a Perl script that uses SQL commands LOCK TABLES, FLUSH TABLES and Unix tools cp or scp to quickly create a database backup. | Yes | No |
| Table storage in files | Each table is a separate file | Data by default is stored in large shared files |
| Binary table copying. Files tables can be transferred between computers with different architectures and operating systems without any conversion. | Yes | No |
| Database table size | Smaller | Larger |
| Failure handling | Entire table crash | Everything can be recovered from logs |
| When storing "logs" etc. | Better | Worse |
Summary:
- MyISAM is better suited for tables where one type of access dominates: read (website with newss) or write (e.g. logging);
- InnoDB should be used in all other cases and when higher data safety requirements are needed.
Request logging.
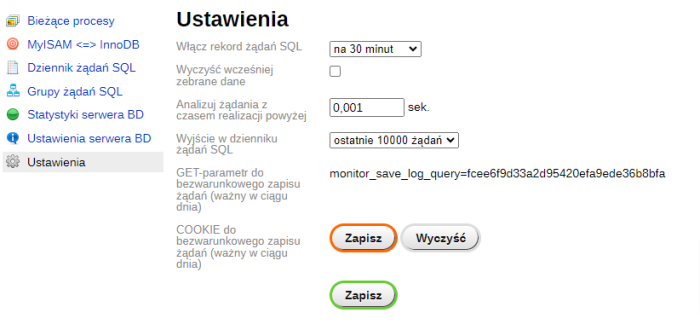
If you select a period during which logging will be performed, the database load will increase because, in addition to normal request processing, information about each request must be saved into the database, so website load will be higher than usual.
To enable logging:
- Set the time period in the setting “Enable SQL request logging” for how long incoming requests from the framework to the database will be stored;
- In the setting “Clear previously collected data”, specify whether previously recorded requests should be deleted before starting new logging;
The red circle next to the “DB Monitor” application icon shows the number of minutes remaining until logging ends.
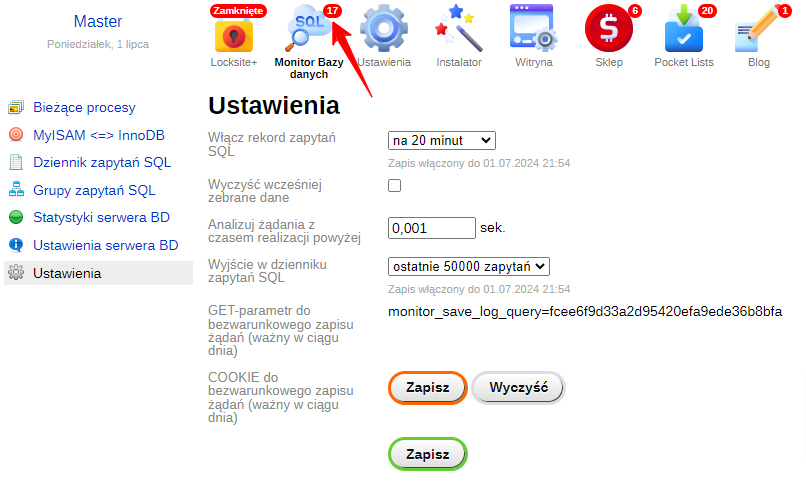
In the setting “Analyze requests with execution time above”, set the time threshold to use when analyzing requests. Only those request groups containing requests with execution times exceeding the specified value will be added to the request list. We recommend starting analysis at 0.1 seconds and further reducing this value as needed. There is no need to restart logging-just change the setting and click “Analyze recorded SQL requests” again.
SQL request analysis.
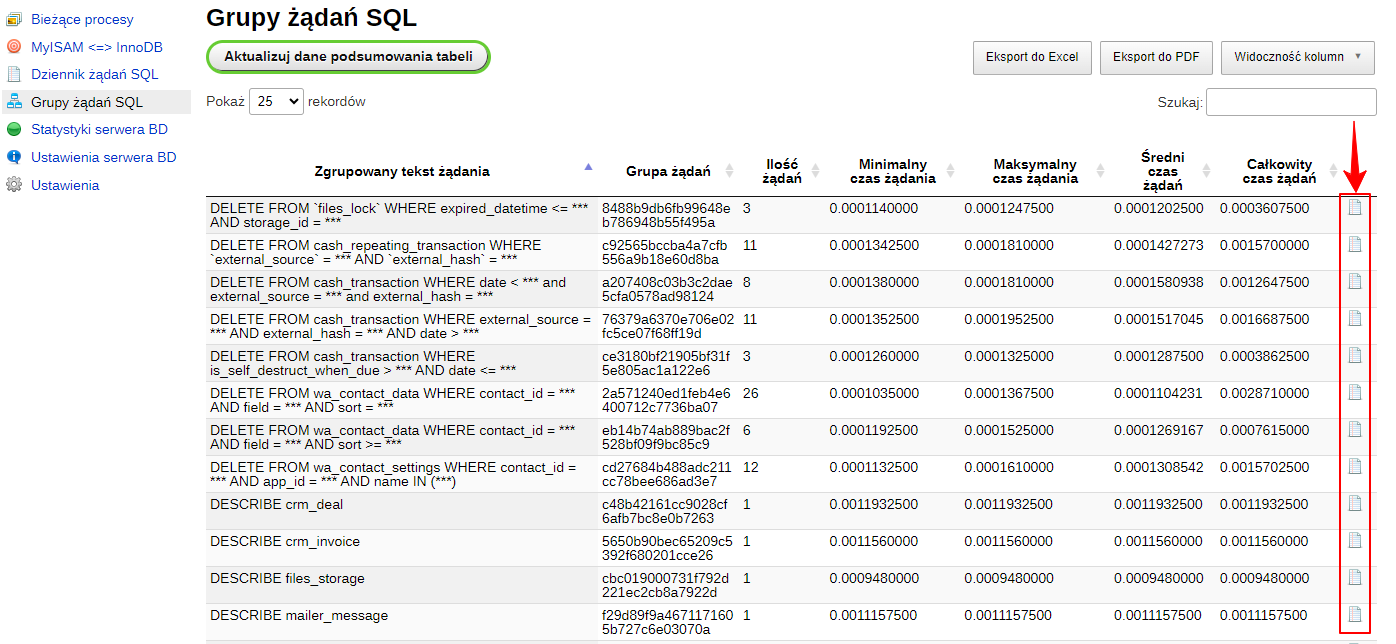
To collect/update data, press the “Update table summary data” button. After completion, the table will display information about grouped queries along with overall statistics. Clicking the sheet icon will open a dialog window with detailed information about that request group.
In the lists of the last 100 and the 100 slowest requests, you can see individual requests within that group, when they were executed, their execution time, and comparison with average time.
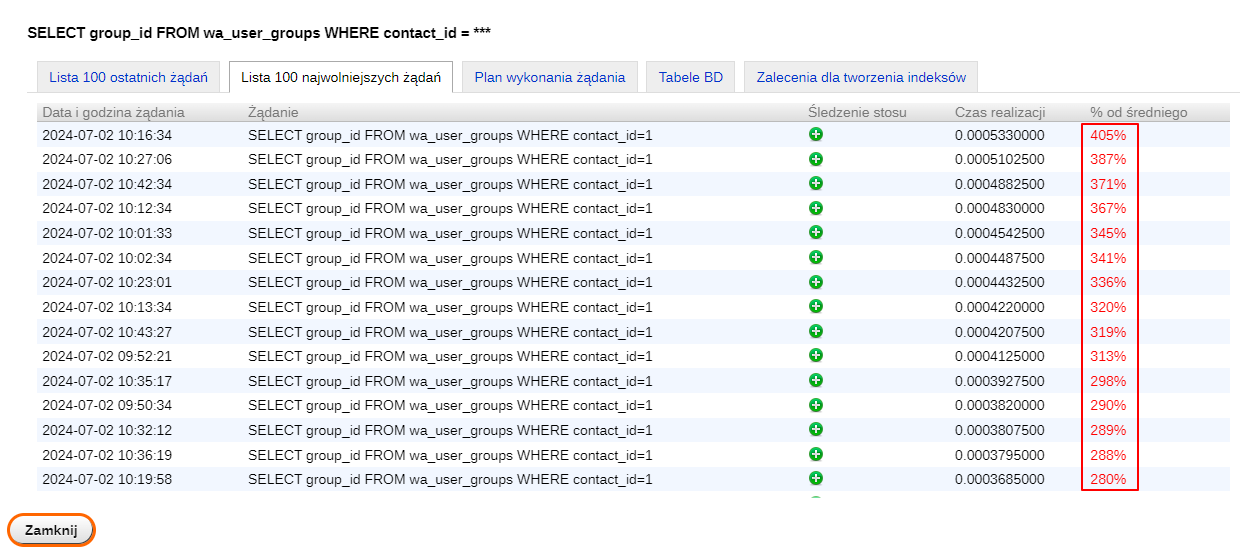
Important! When clicking this button, the execution time of the slowest request in the group is checked, so do not be alarmed if the value exceeds 100% of the average-compare it instead with the maximum request execution time shown on the page.
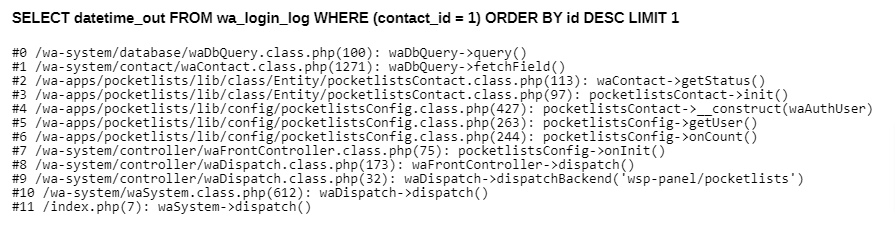
Clicking the green circle icon with a plus sign displays the function call stack that led to this request. This information helps identify which plugin, app, class, or method caused this request to be created.
The "Query Execution Plan" tab contains information that can help optimize request performance. This information is useful for plugin and application developers analyzing and resolving performance issues with their requests.

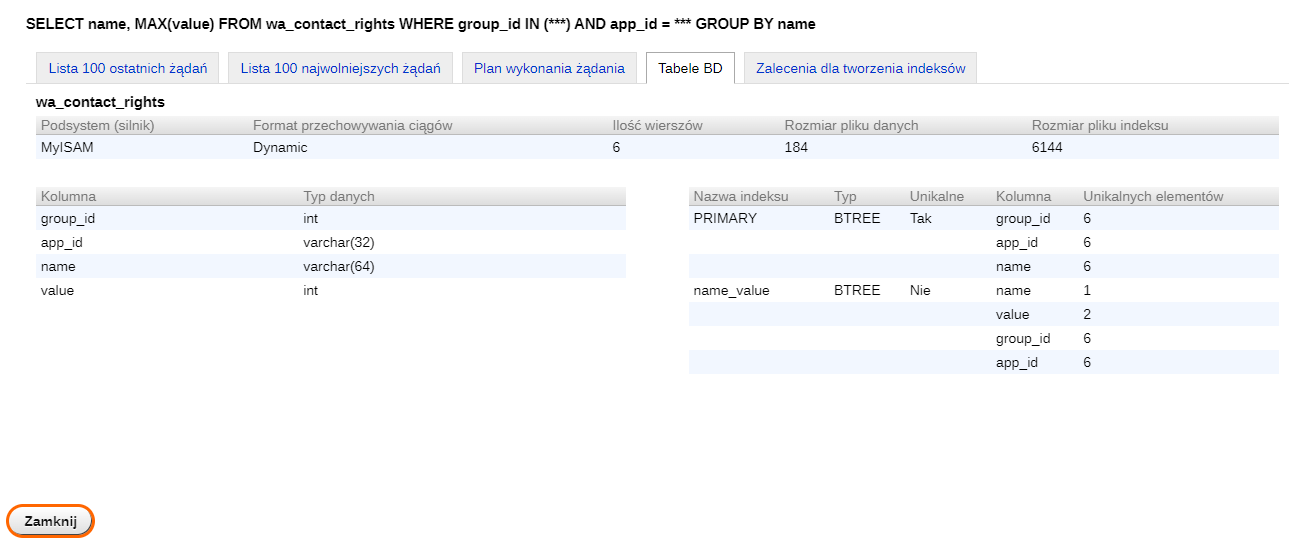
The "Database Tables" tab contains information (storage engine, storage format, data size, list of columns with data types, list of indexes) about all database tables involved in the request.
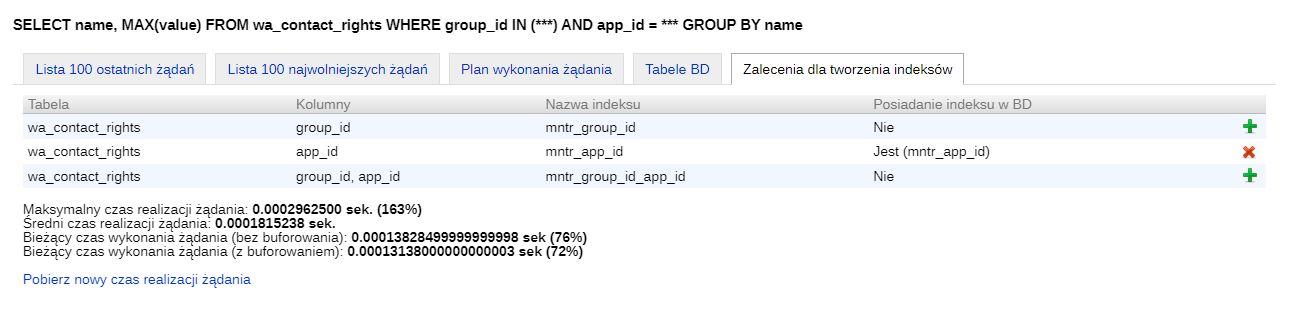
In the "Index Creation Recommendations" tab, you can add recommended indexes (including composite indexes) or remove indexes previously added by the application. Indexes in MySQL are an excellent tool for optimizing SQL queries. Keep in mind that indexes involve additional disk write operations. Each time you update or add data to a table, index data is also written and updated. Create only the indexes that are necessary to avoid wasting server resources. Analyze how much the request execution time changes after adding or removing a particular index using the "Get new request execution time" link.
| Technical specifications | |
Localization settings | English, Polish, Russian |
Installed in the cloud | No |
UI backend support | 1.3 |
Software type | Application |
Free | No |
| Developer and application version | |
Designer (programmer) | Kreatyw IT |
License | Web Systems Pro |
Version | 1.1.0.1.wsp |
Update | 07/02/2024 |